Understand VMware DRS Scores
About this task
BVQ introduces the DRS Score as an additional metric designed to evaluate the efficiency and balance of VMware clusters.
Applies to
BVQ Grafana Dashboards
VMware - All vCenters & VMware - VM Clusters
Procedure
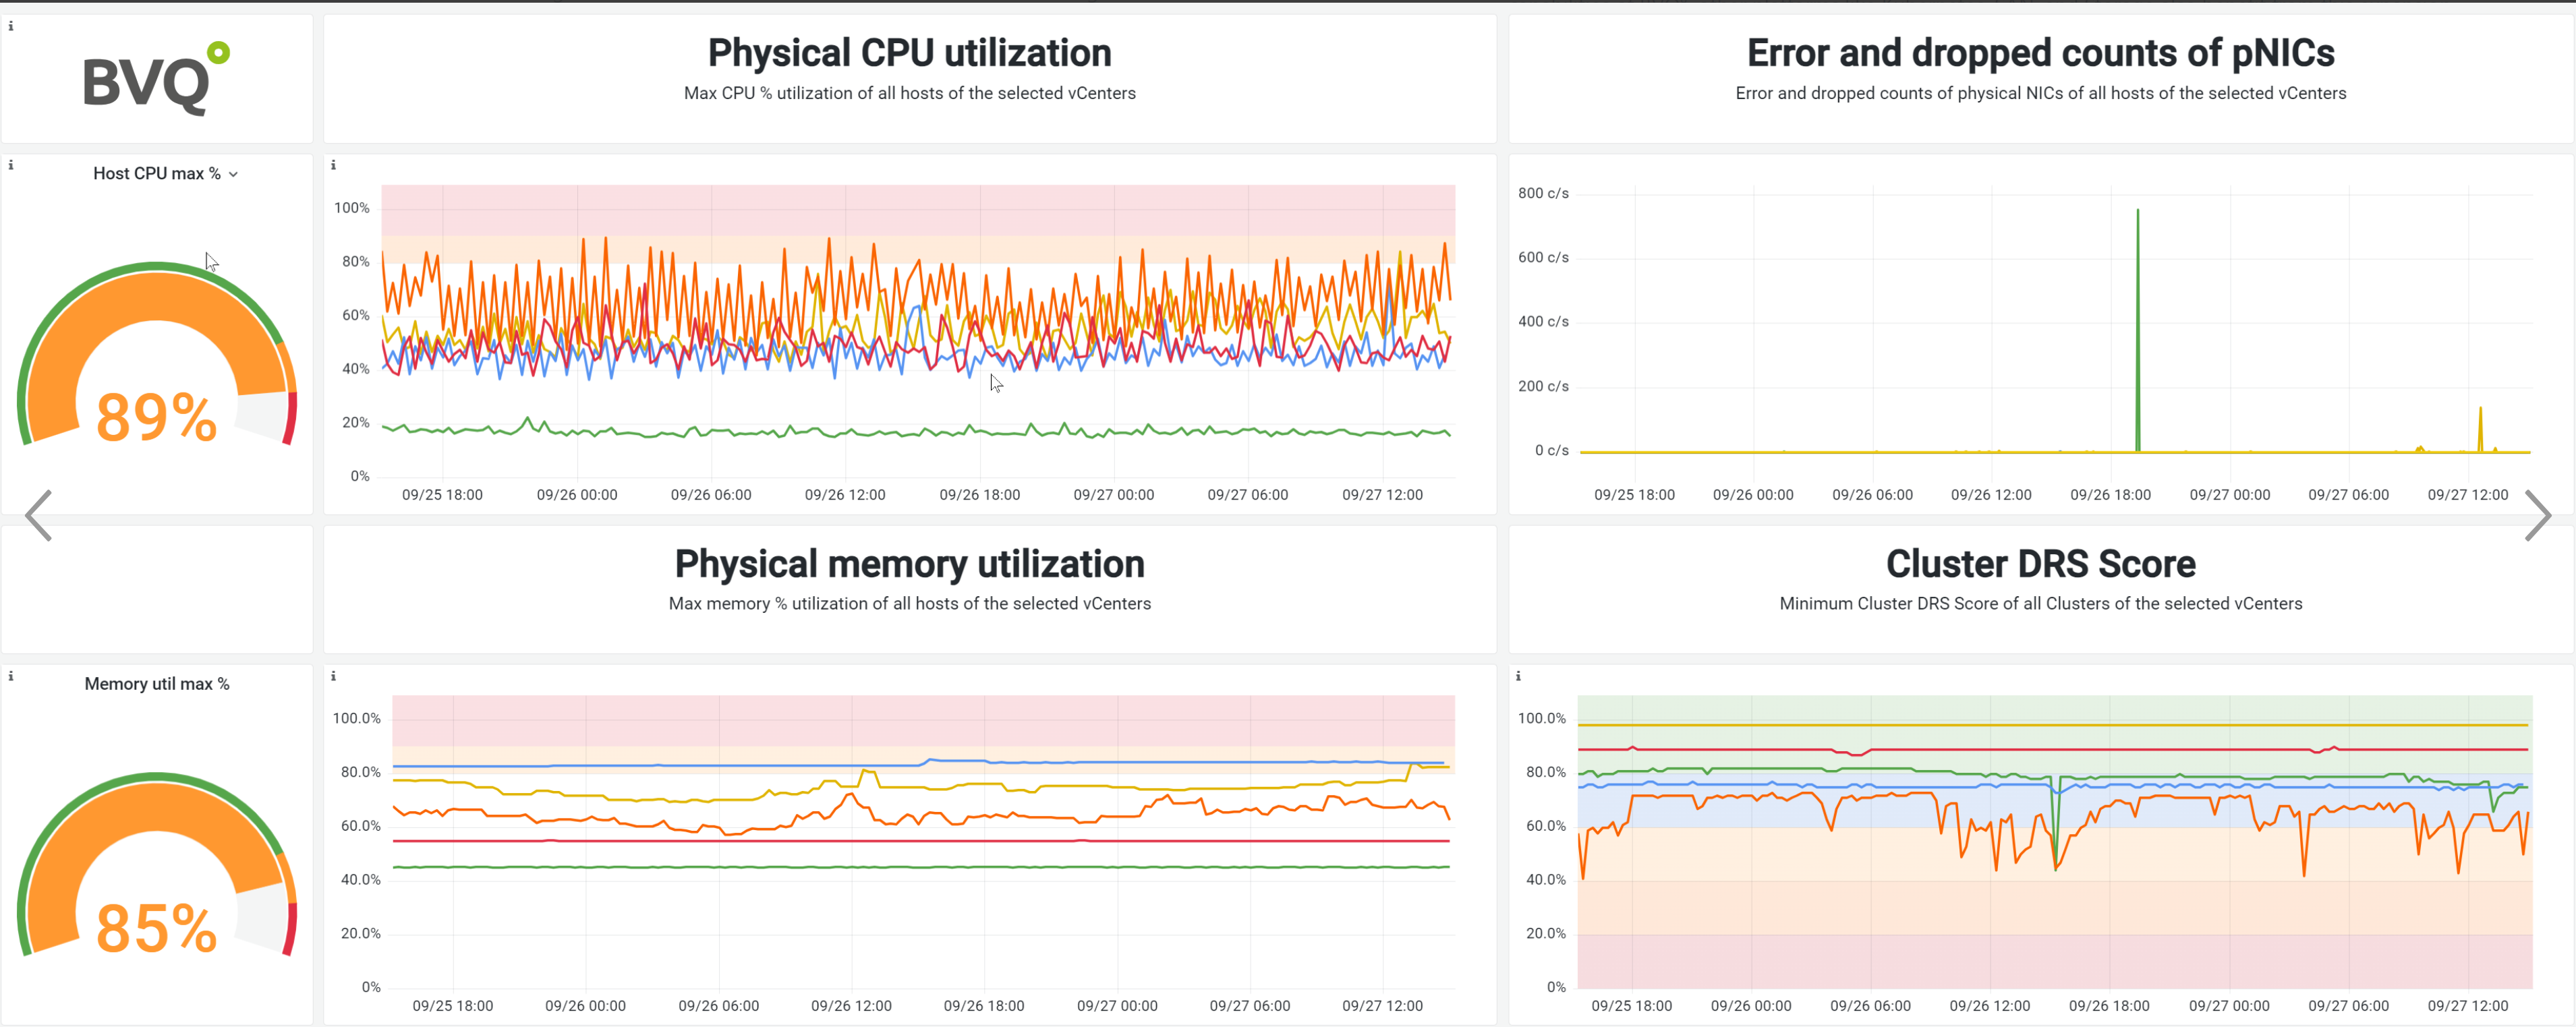
Fig.: In this example, the DRS Score is integrated into the monitoring of all VMware vCenters
(bottom right). It compactly displays which systems are overloaded and where VM performance
is reduced due to bottlenecks. The orange line on the dashboard indicates a poorly balanced
vCenter, which can be used as a starting point to identify affected hosts and virtual machines
through simple drill-down methods.
Core Objectives of the DRS Score:
Scope of Application:
Initially, the DRS Score is offered for the vCenter. Plans are underway to extend this offering to individual VMs, providing users the ability to drill down from the cluster level to the causative VM.Function of DRS:
The Distributed Resource Scheduler (DRS) acts as an automated system management tool. Its primary objective is to ensure that every server within a collective, known as a "cluster", maintains an equitable workload, represented by the virtual machines (VMs) it runs.Score Interpretation:
The DRS Score ranges between 0% and 100%. A score of 100% signifies optimal balance, meaning all servers are contributing equally to the workload. A lower score indicates an imbalance in workload distribution.Operational Implications:
In the event of imbalances, the DRS can make or recommend adjustments to ensure each server neither remains underutilized nor becomes overwhelmed.
Conclusion:
The DRS Score presented by BVQ provides a precise method to assess workload equilibrium in a virtualized environment, facilitating efficient management and optimal performance. With the planned extension to individual VMs, users will gain an even more granular view, enhancing their troubleshooting and management capabilities.
| DRS Score | vCenter Evaluation | Cluster Evaluation | Host Evaluation | VM Evaluation |
|---|---|---|---|---|
| 100% | Optimal operation | Perfectly balanced | No overcommitment | VMs are satisfied |
| 80% | Efficient operation | Minor imbalances | Slight overcommitment | Minor VM performance concerns |
| 60% | Acceptable operation | Noticeable imbalances | Moderate overcommitment | Some VMs may be affected |
| 50% | Fair operation | Considerable imbalances | High overcommitment | Half of VMs might have concerns |
| 40% | Reduced efficiency | Major imbalances | Very high overcommitment | Majority of VMs affected |
| 20% | Poor operation | Severe imbalances | Critical overcommitment | Critical performance issues for most VMs |
